
Downloadable resources
Tools to decide better, ready to use.
Guides, templates and spreadsheets from the Criterio Nyxum series. Each one includes a one-page infographic with what matters most. Free of charge.
Artificial intelligence
 Includes an infographic
Resource 01PDF
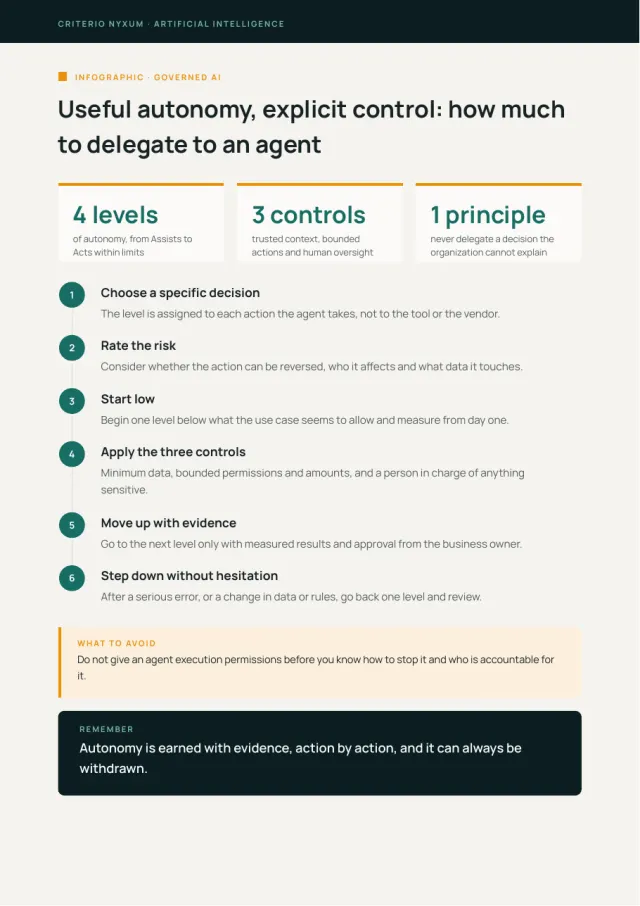
Autonomy scale for AI agents
How much autonomy to give an agent, with which data and under which controls.
For: Executive leadership and IT
 Includes an infographic
Resource 02Word
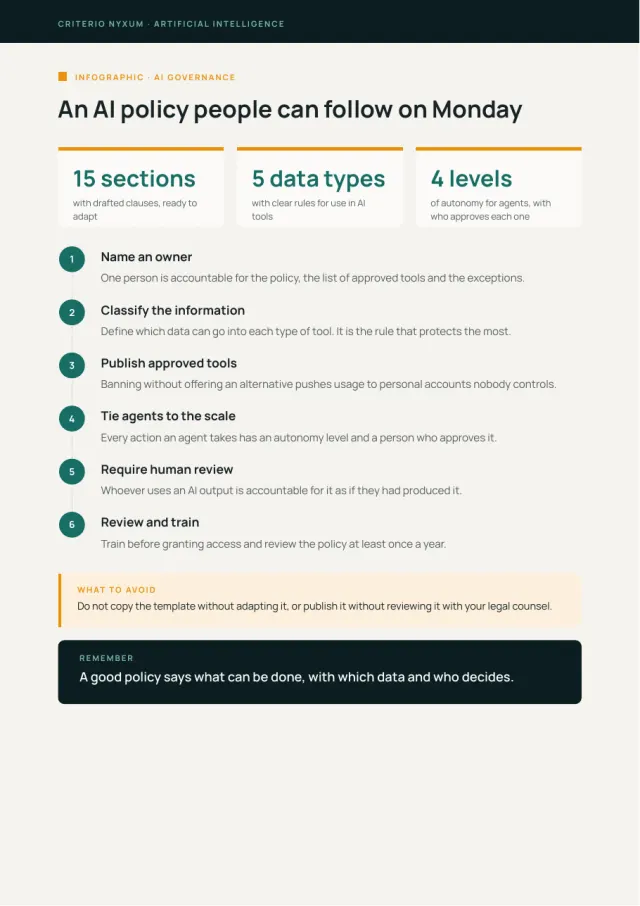
Model AI use policy
A policy ready to adapt: what can be done with AI, with which data and who approves.
For: Legal, Human Resources and IT
 Includes an infographic
Resource 03Excel
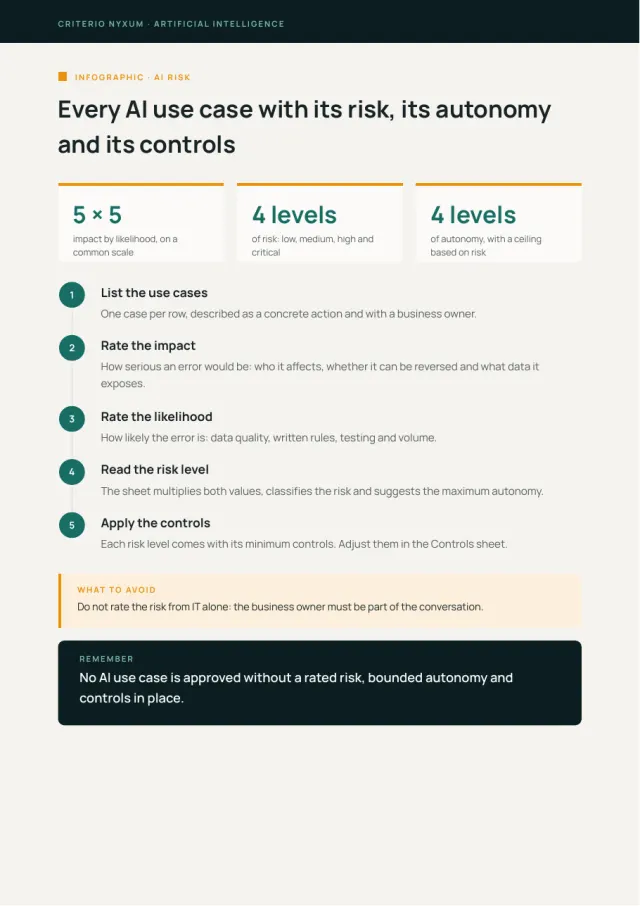
AI use case risk matrix
Rate each use case by impact and likelihood and know which controls it requires.
For: Risk, compliance and IT
 Includes an infographic
Resource 04Excel
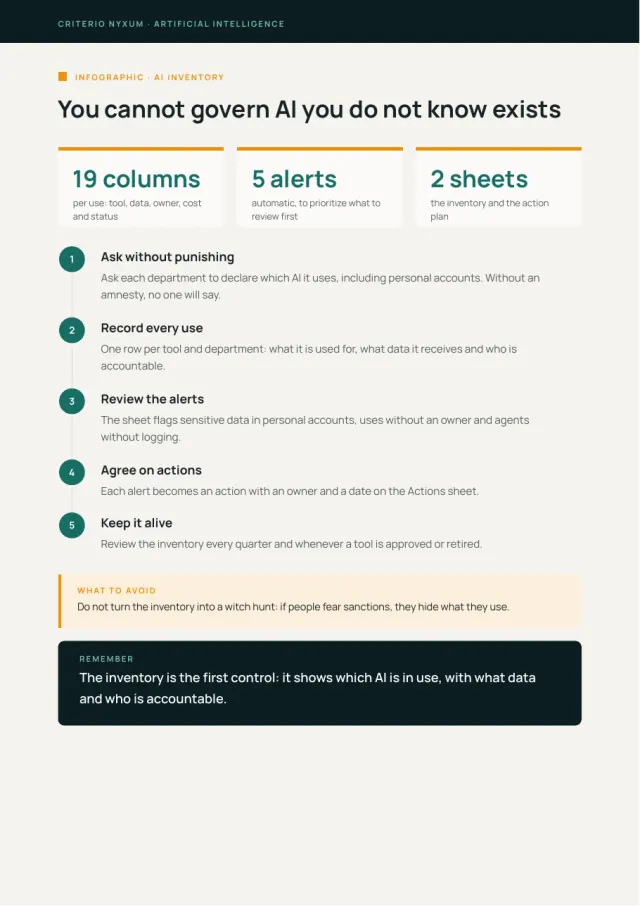
AI use inventory
Record which AI tools are in use, with what data and under which owner.
For: IT, risk and leadership
 Includes an infographic
Resource 05Word
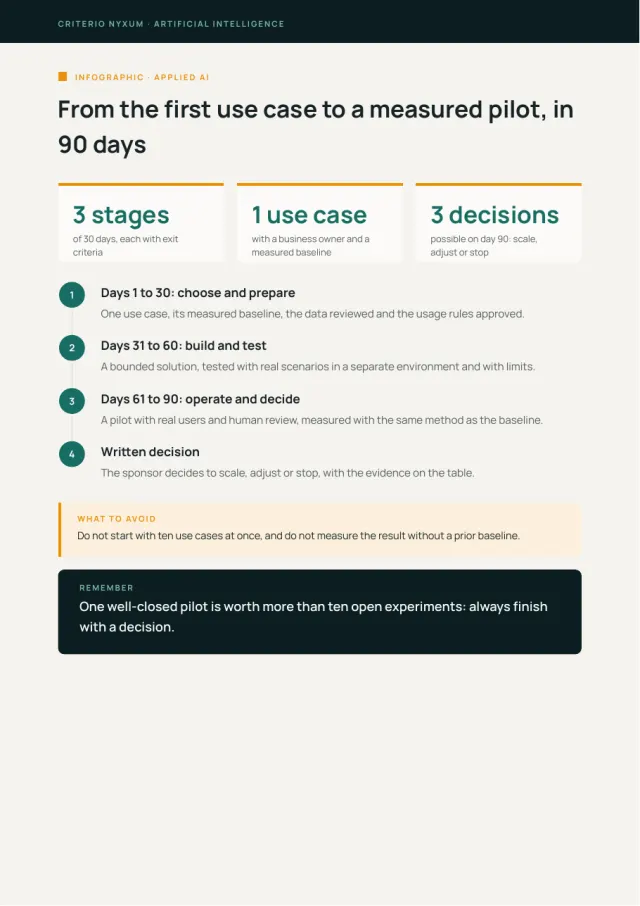
90-day AI plan
From the first use case to a measured pilot, in three 30-day stages.
For: Executive leadership
 Includes an infographic
Resource 06PDF
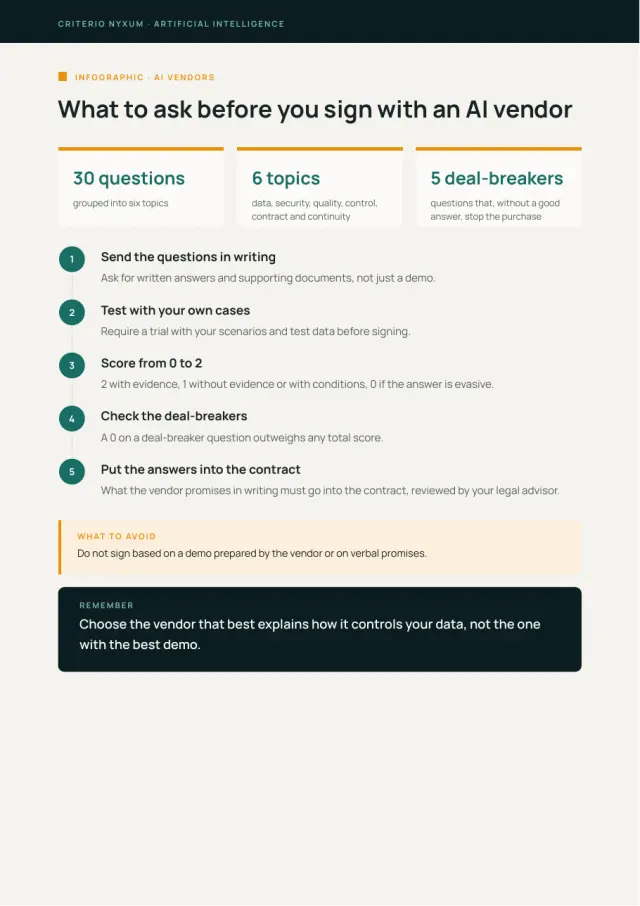
How to evaluate an AI vendor: 30 questions
The questions worth asking before you sign with an AI vendor.
For: Procurement, IT and legal
Salesforce
 Includes an infographic
Resource 07PDF
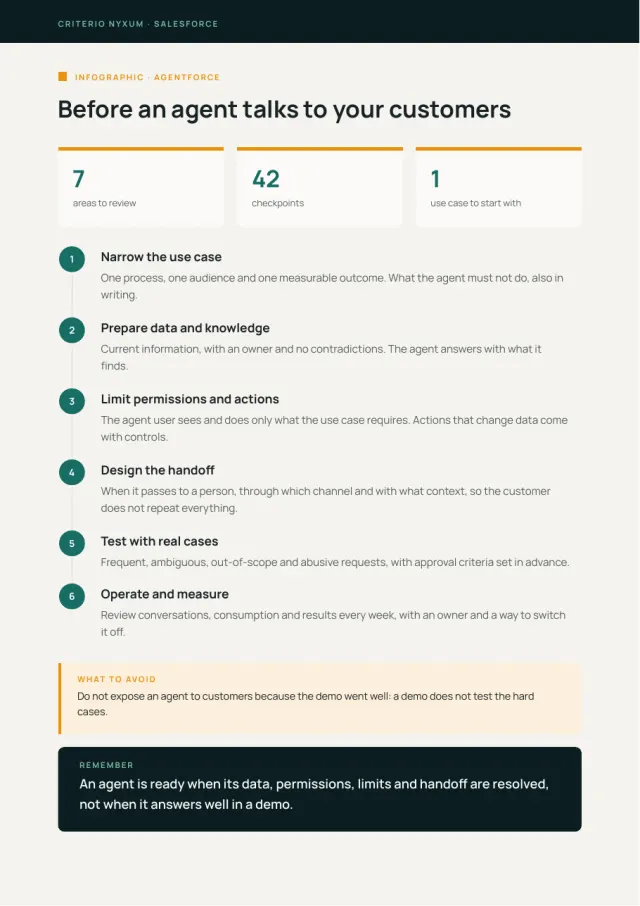
Ready for Agentforce? A checklist
What must be in place before you put an agent in front of customers.
For: Salesforce admins and process owners
 Includes an infographic
Resource 08Excel
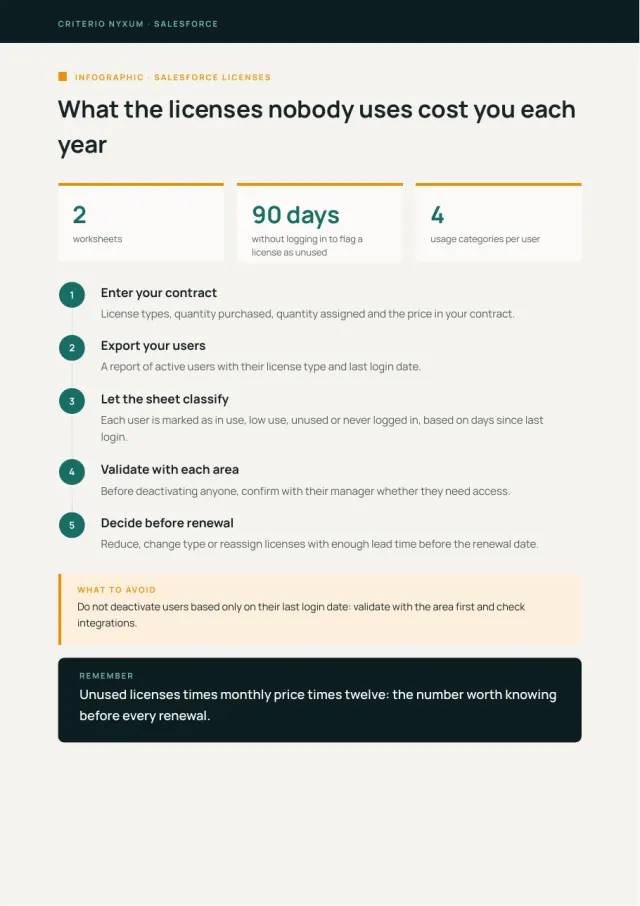
Salesforce license audit
Find unused licenses and calculate what they cost you each year.
For: Finance and IT
 Includes an infographic
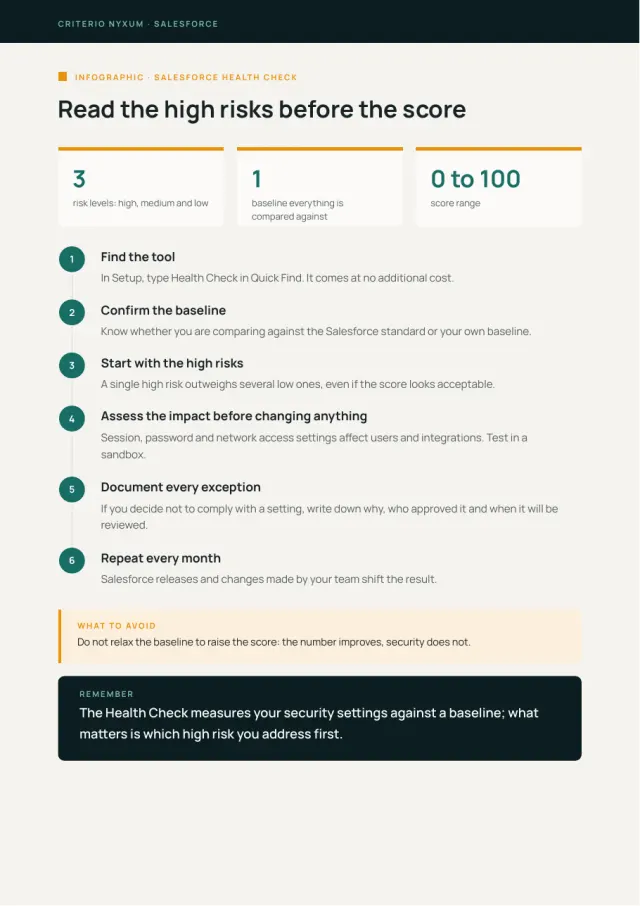
Resource 09PDF
How to read the Salesforce Health Check
What each Health Check risk means and which one to address first.
For: Salesforce administrators
 Includes an infographic
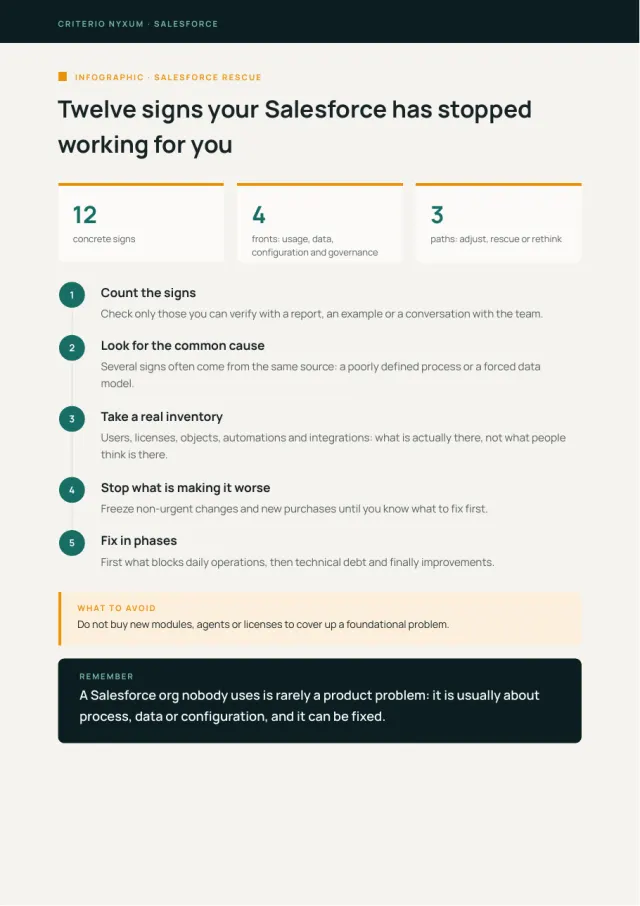
Resource 10PDF
Signs your Salesforce implementation needs a rescue
Twelve concrete signs and what to do about each one.
For: Executive management
 Includes an infographic
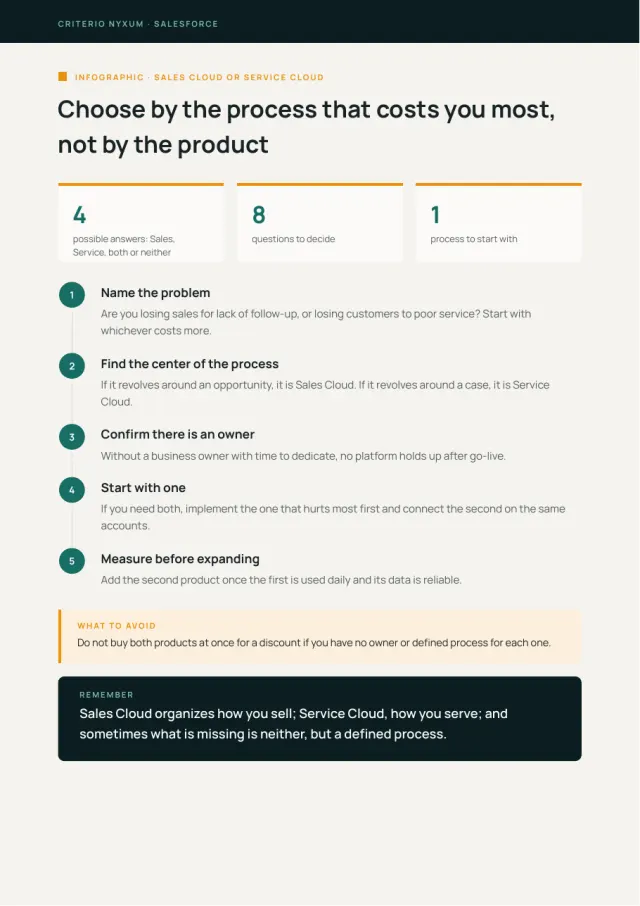
Resource 11PDF
Sales Cloud, Service Cloud or both: a decision guide
Which one fits your process, and when you need neither.
For: Executive management and IT
Data
 Includes an infographic
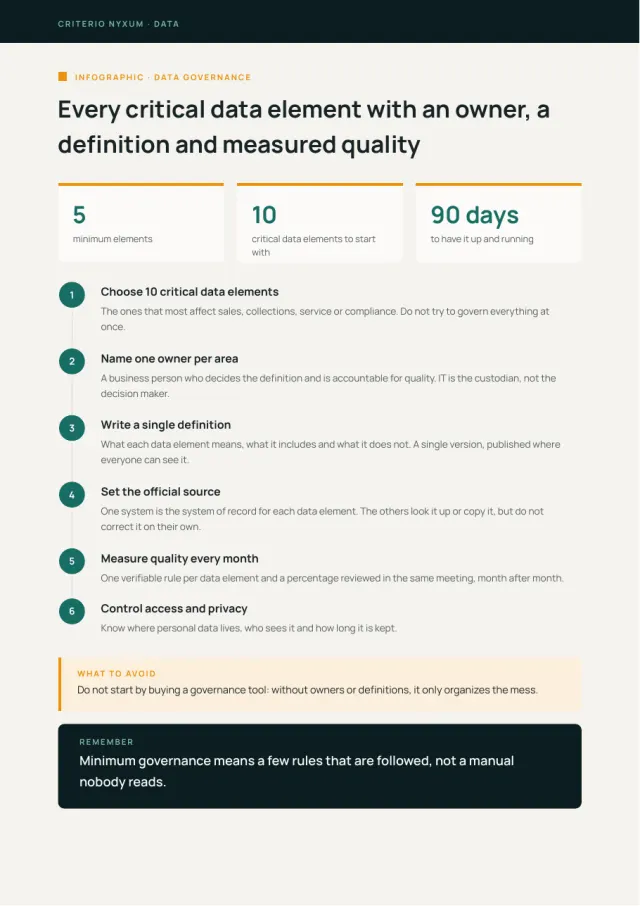
Resource 12PDF
Minimum viable data governance
The minimum needed for your data to have an owner, a definition and measured quality.
For: Data and IT
 Includes an infographic
Resource 13Excel
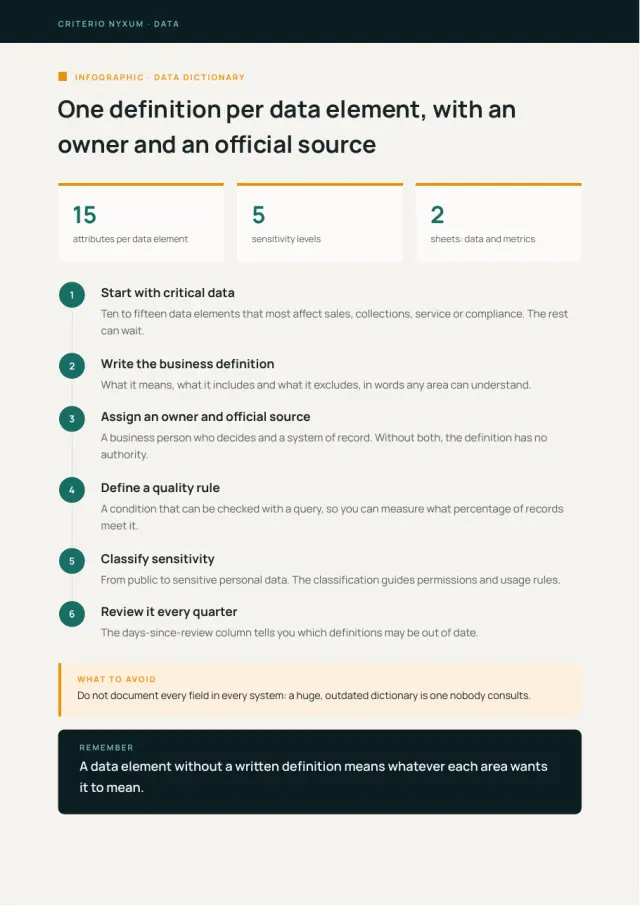
Data dictionary
A single definition for each key data element, with its owner and official source.
For: Data, IT and business teams
 Includes an infographic
Resource 14Excel
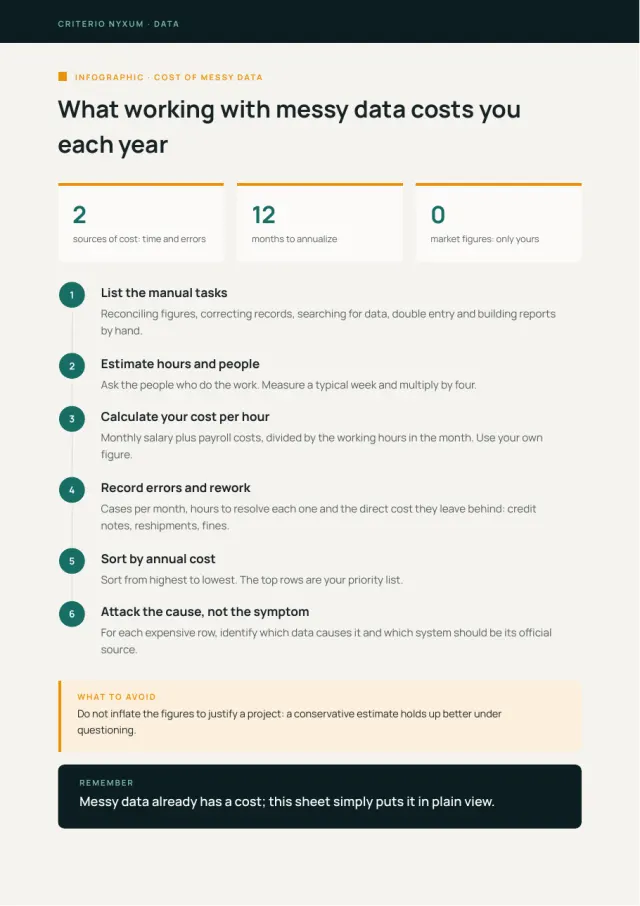
Cost of messy data calculator
Estimate, with your own figures, how much working with messy data costs you each year.
For: Finance and operations
 Includes an infographic
Resource 15Excel
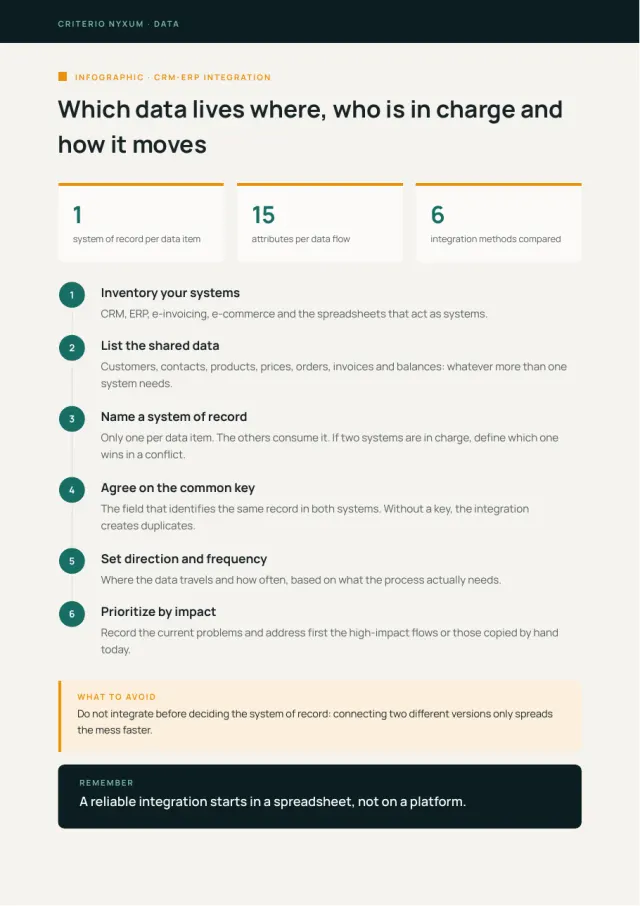
CRM-ERP integration map
Which data lives where, which system is in charge and how it moves between systems.
For: IT and architecture
Transformation
 Includes an infographic
Resource 16PDF
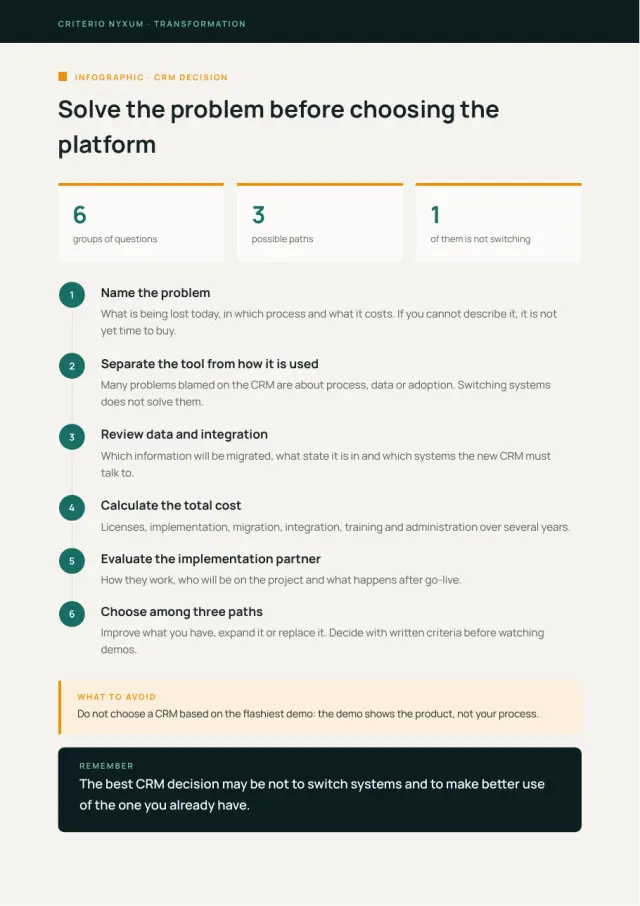
Questions to ask before buying or switching CRMs
What to resolve before choosing a platform or an implementation partner.
For: Executive management
 Includes an infographic
Resource 17Word
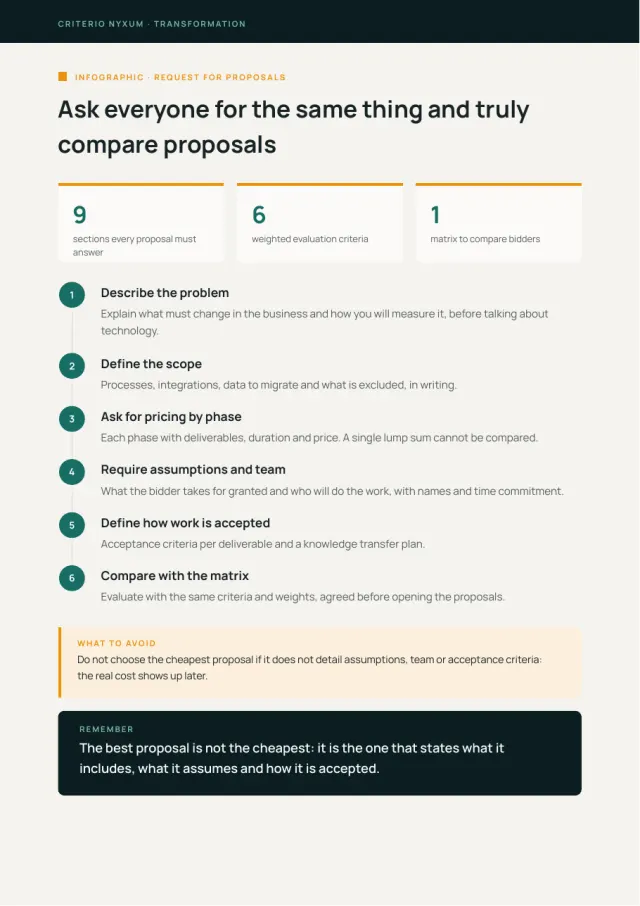
Request for proposals for implementation partners
A template to request comparable proposals and avoid surprises.
For: Procurement and IT
 Includes an infographic
Resource 18Excel
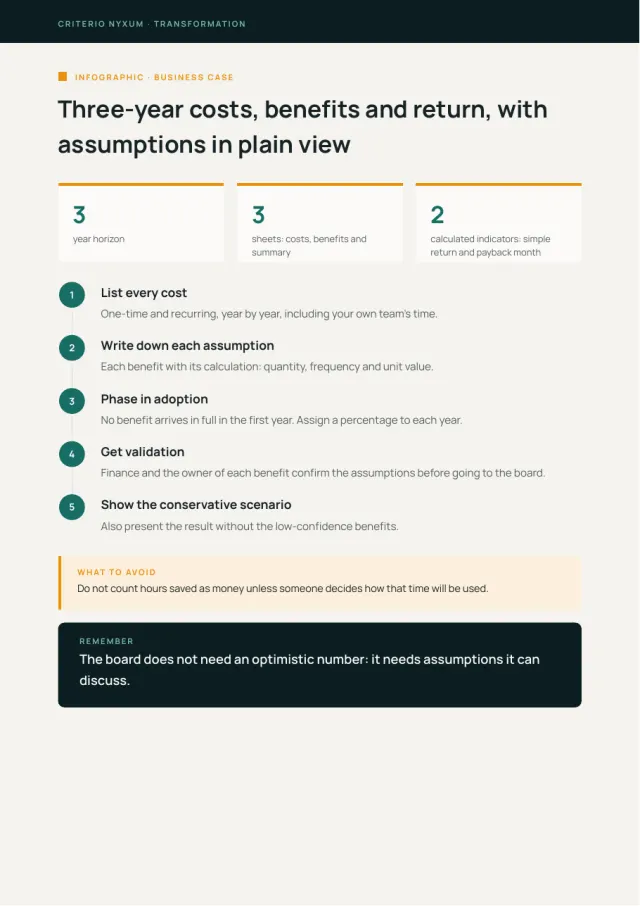
Business case for the board of directors
Costs, benefits and return of an initiative, with every assumption in plain view.
For: Finance and executive leadership
 Includes an infographic
Resource 19Excel
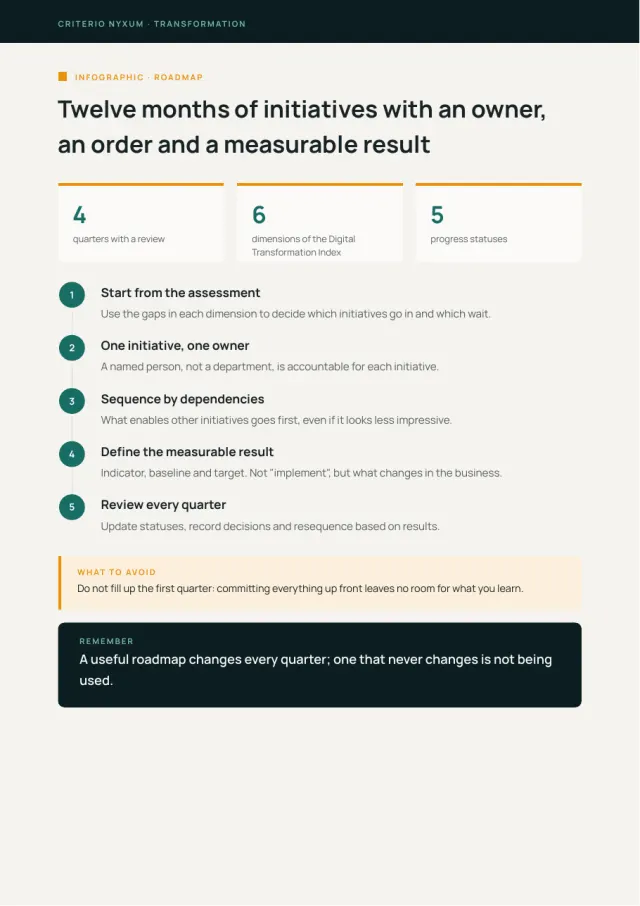
12-month roadmap
Initiatives, owners and expected results, quarter by quarter.
For: Leadership and PMO
 Includes an infographic
Resource 20Word
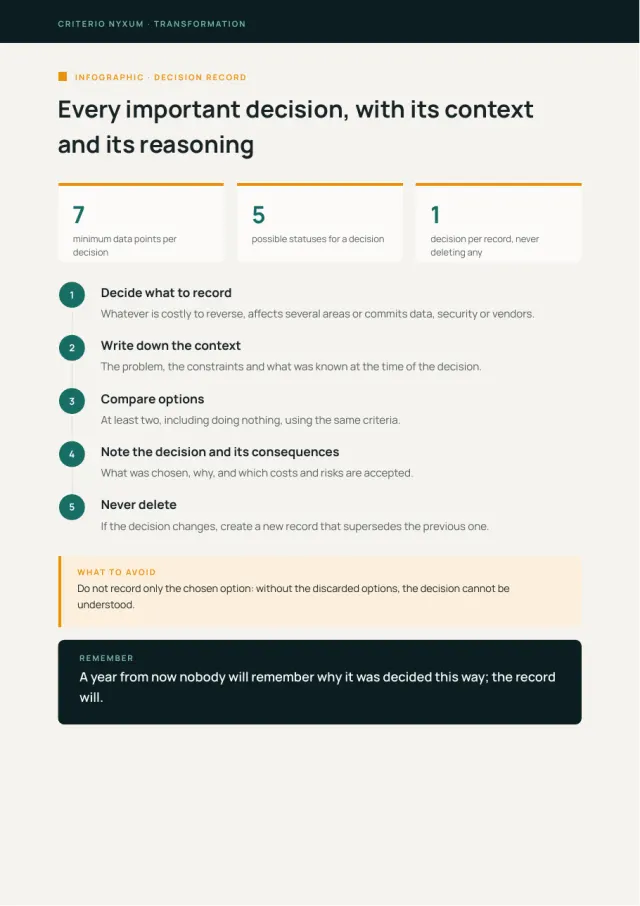
Architecture decision record
Document every important decision: context, options and why it was chosen.
For: Architecture and IT
People
 Includes an infographic
Resource 21Word
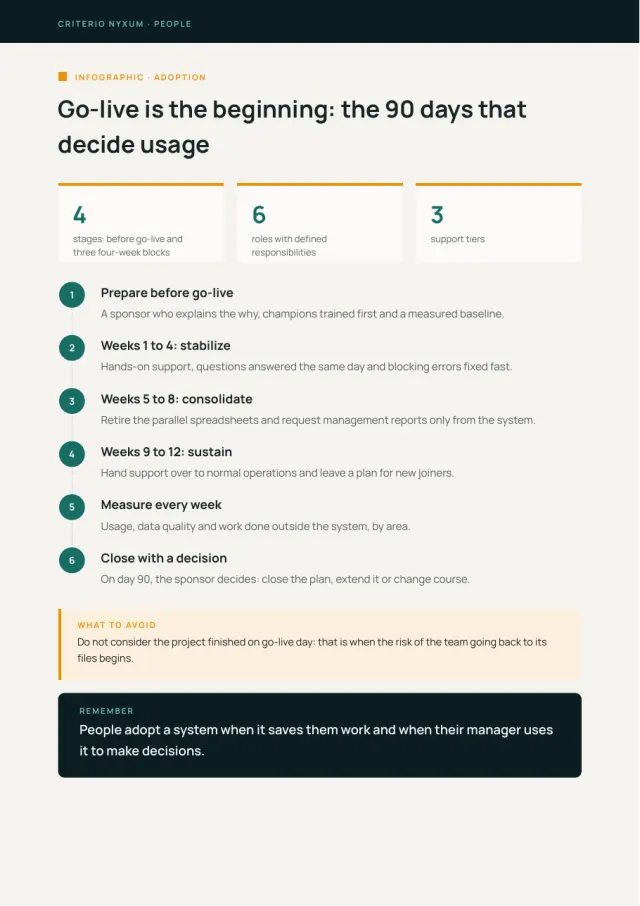
Adoption plan for the first 90 days
How to get people to use the system after go-live.
For: Operations and team leaders
 Includes an infographic
Resource 22Excel
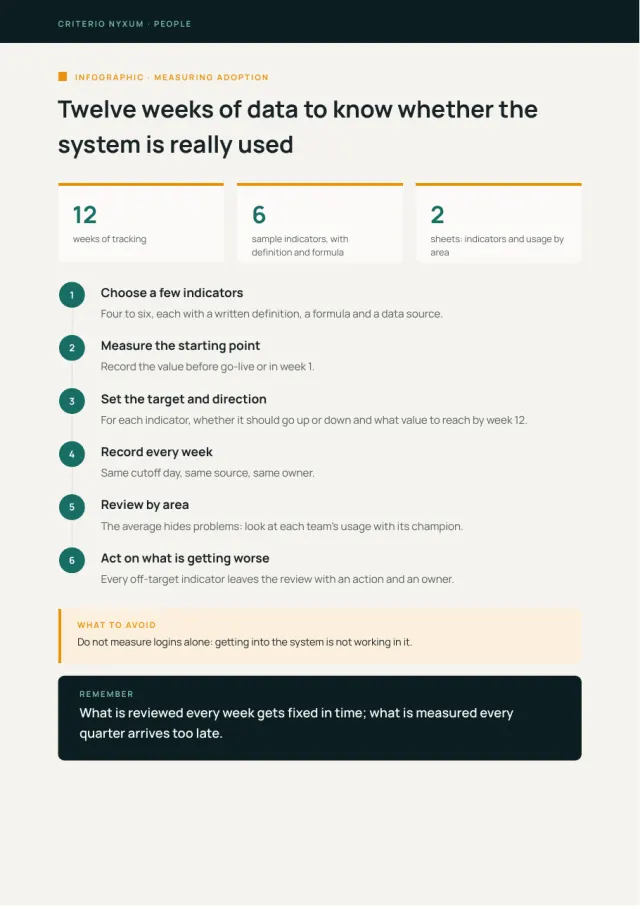
Adoption dashboard: what to measure every week
Weekly indicators to know whether the system is really being used.
For: Operations and IT
Finance
 Includes an infographic
Resource 23Excel
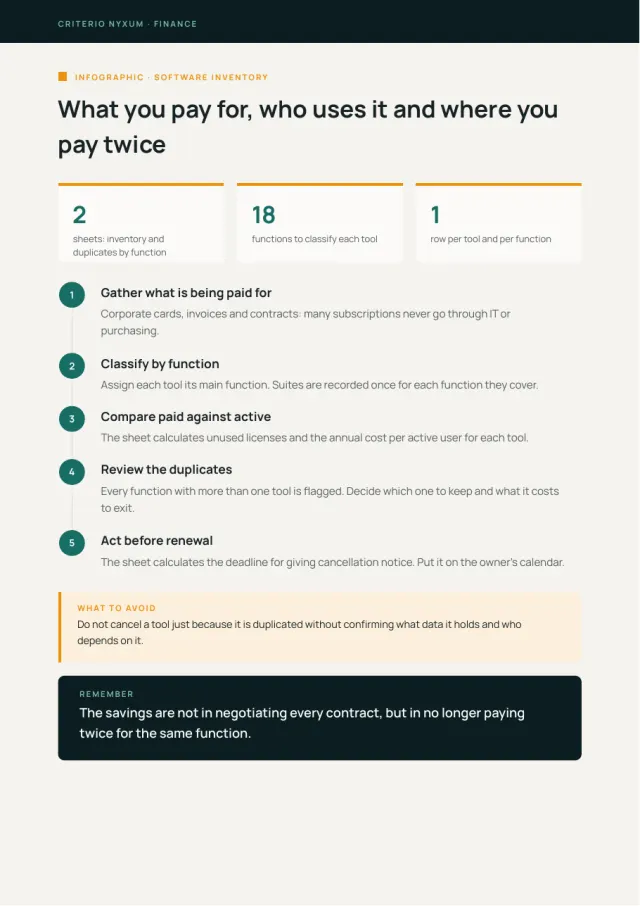
Software inventory and duplicate costs
List what you pay for, who uses it and where you pay twice for the same thing.
For: Finance and IT
Industry guides
 Includes an infographic
Resource 24PDF
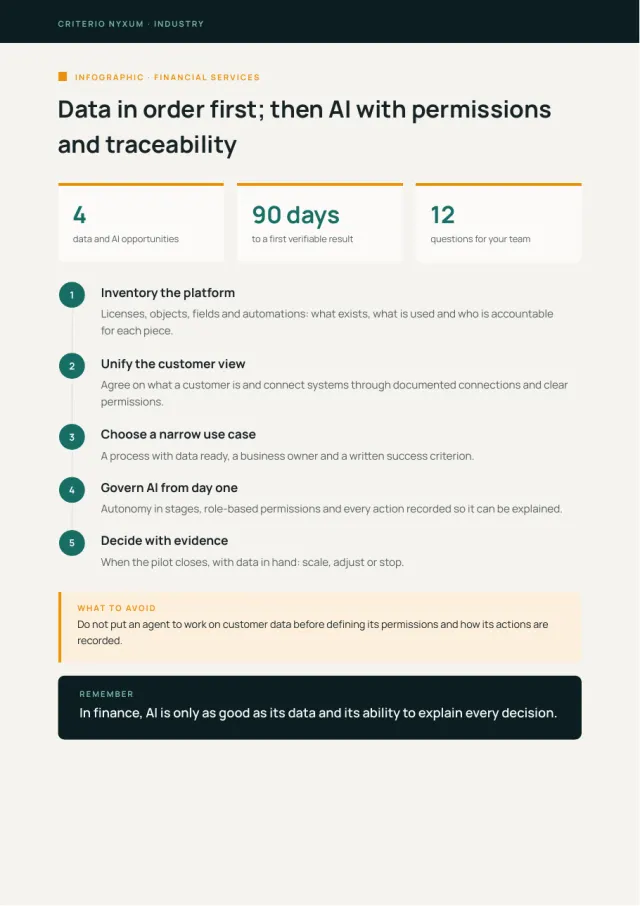
Sector guide: financial services
Where data and AI opportunities tend to sit in the sector, and what to watch out for.
For: Sector leadership
 Includes an infographic
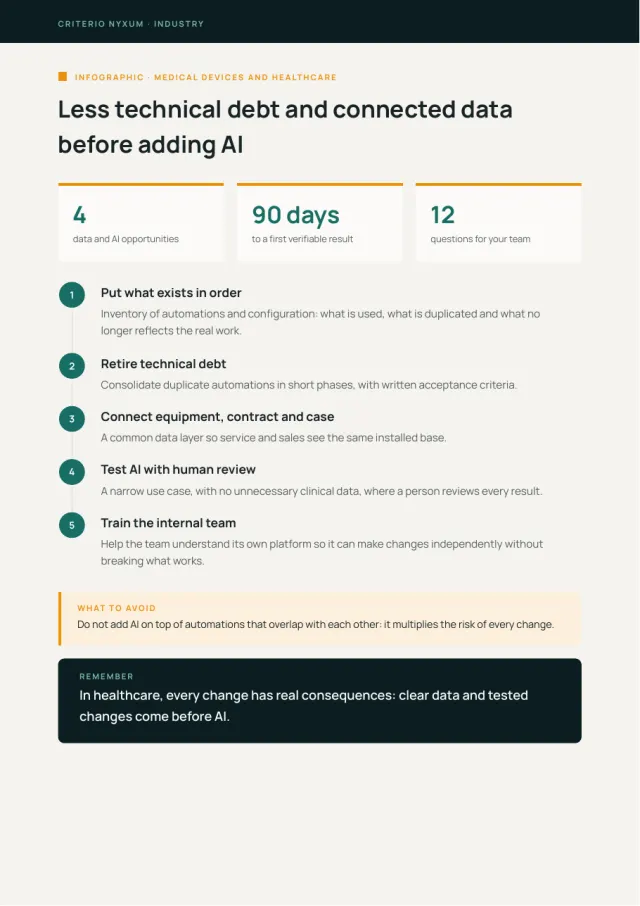
Resource 24PDF
Sector guide: healthcare
Where data and AI opportunities tend to sit in the sector, and what to watch out for.
For: Sector leadership
 Includes an infographic
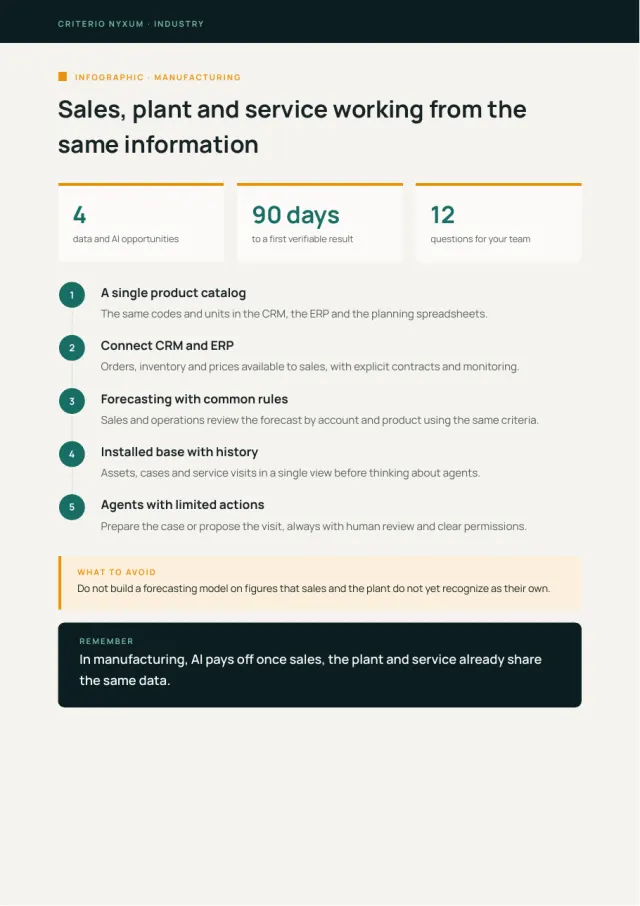
Resource 24PDF
Sector guide: manufacturing
Where data and AI opportunities tend to sit in the sector, and what to watch out for.
For: Sector leadership
 Includes an infographic
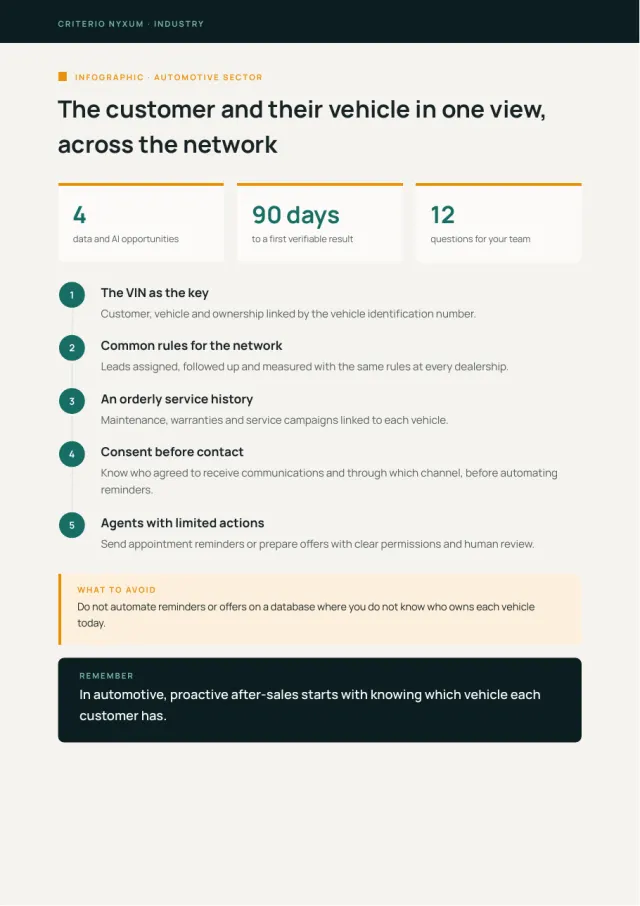
Resource 24PDF
Sector guide: automotive
Where data and AI opportunities tend to sit in the sector, and what to watch out for.
For: Sector leadership
 Includes an infographic
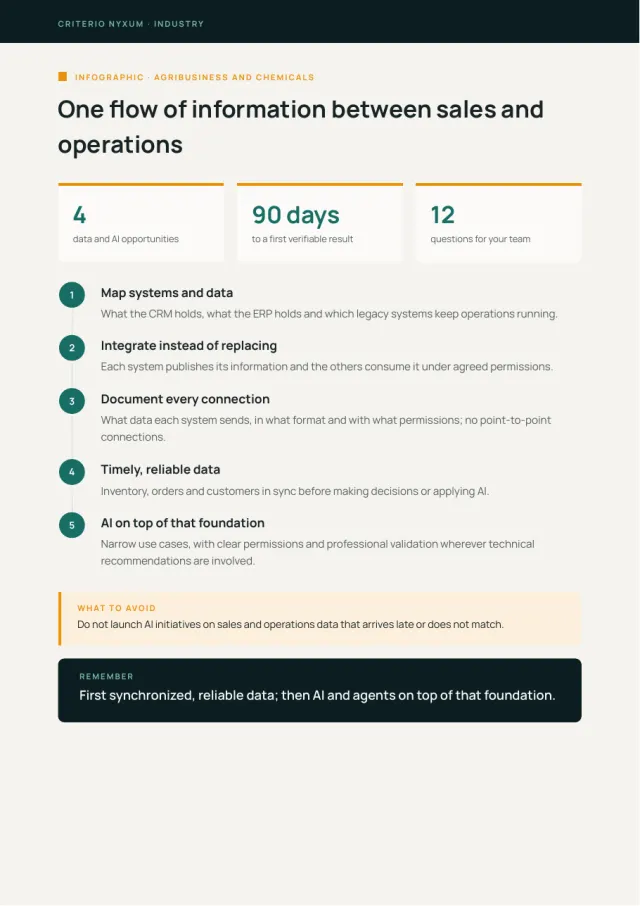
Resource 24PDF
Sector guide: agribusiness
Where data and AI opportunities tend to sit in the sector, and what to watch out for.
For: Sector leadership